Waar ben je naar op zoek?
Meest gezocht
Andere zochten naar...
Populaire diensten
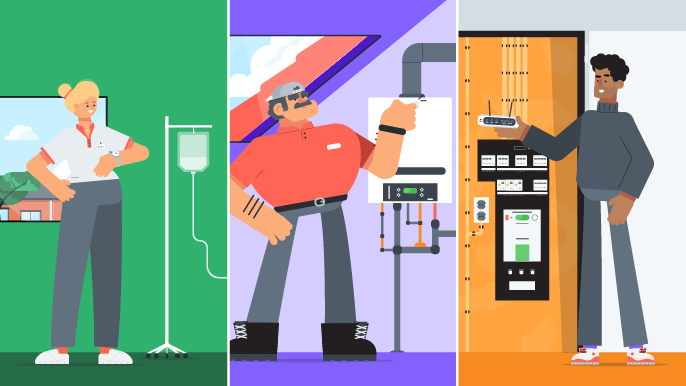
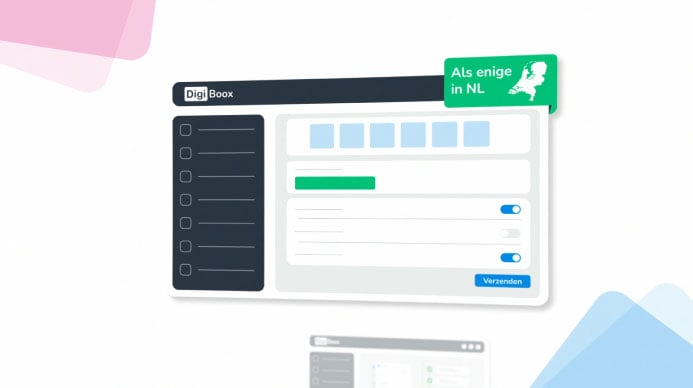
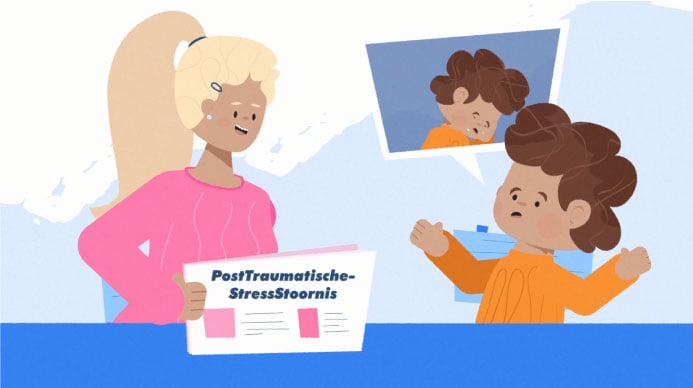
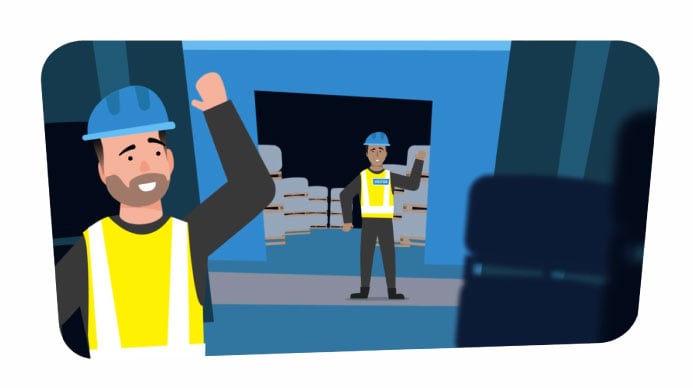
Onze populairste diensten en oplossingen

Een selectie uit meer dan 3000 projecten vanaf 2011 tot nu. Op zoek naar voorbeelden die passen bij jouw vraagstuk? Filter eenvoudig op het type product, jouw eigen branche of het thema waar je mee bezig bent voor de meest relevante voorbeelden!

Lars Weijers
Accountmanager

Helen Berger
Creative Producer

Daniël Visscher
Art Director
Omschrijf je wensen en krijg op werkdagen binnen het uur reactie.
"*" geeft vereiste velden aan